Today we reached an important milestone for Home Assistant Analytics: 100,000 users have chosen to join!
This is a big deal because it isn’t on by default, users have to sign in, and we only launched Home Assistant Analytics last April. We advertised it in the release blog post and during live streams but never annoyed existing users in the UI. New users were asked to log in as part of the onboarding process.
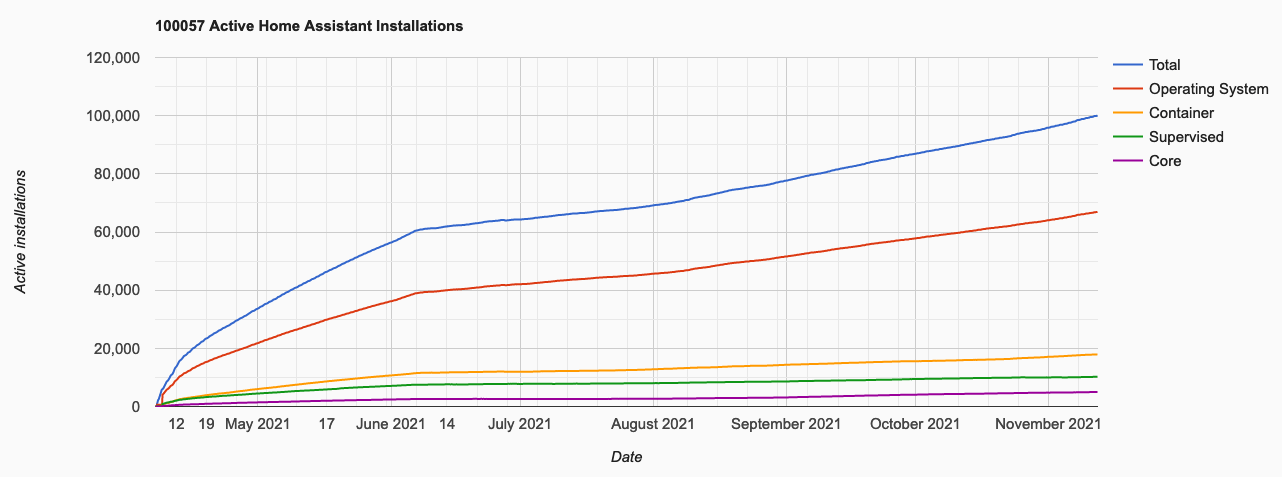
The 100,000 installations are not the total number of Home Assistant users. The truth here is that we don’t know the total number of installs because Home Assistant is inherently private. We estimate there are 4-5x more installations than people who choose analytics.
For the latest version of the graphs in this post, see Home Assistant Analytics
Why we collect data
It’s good to start with why we allow users to share some data with us.
Manufacturers of IoT products live in their own world in which we have little presence. We don’t have any booths at CES or other trade shows. Instead, manufacturers see that we are open source and assume that it is a small user base. They assume that the ability to integrate with Home Assistant and other platforms is not profitable enough to allocate resources to add the necessary APIs for integration.
With the data collected by Home Assistant Analytics, we can show that providing an API can expand your market around the globe.
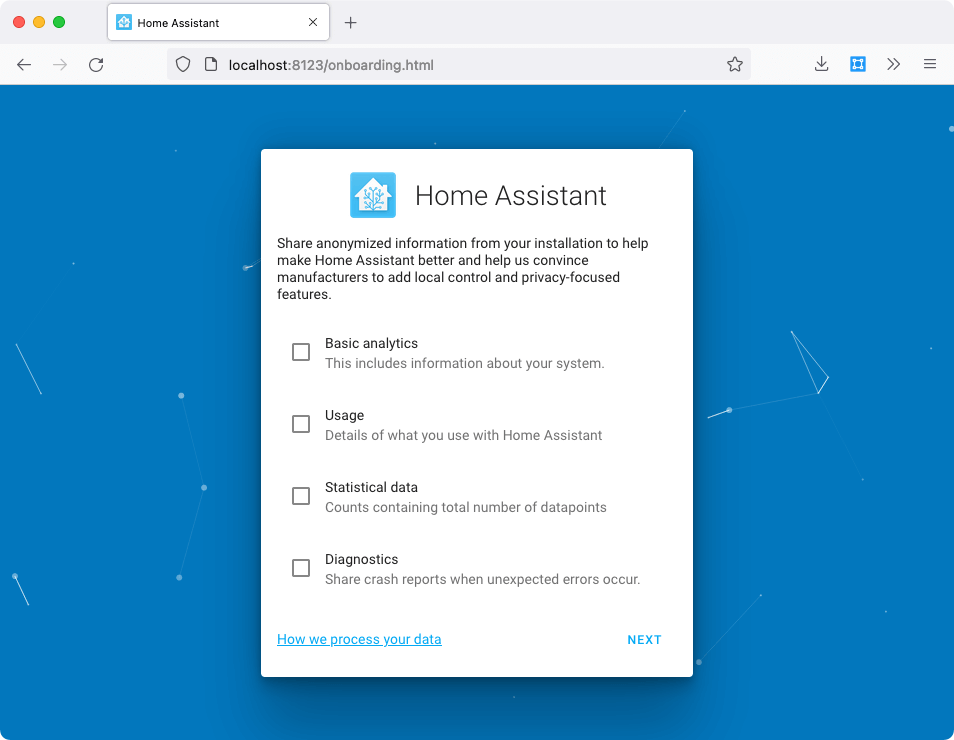
Screenshot of the analysis when onboarding Home Assistant
This is how users run Home Assistant
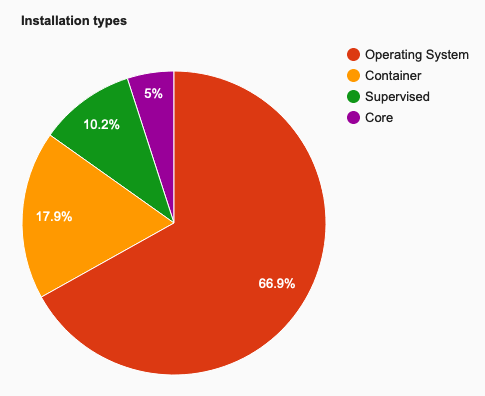
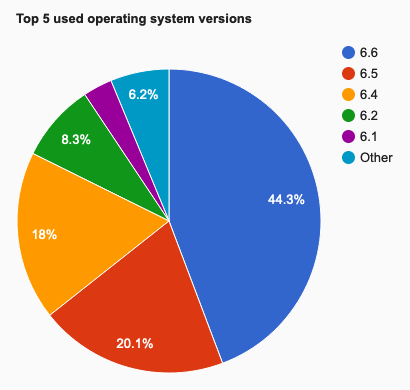
The data collected is also used to give us, the Home Assistant developers, an insight into how Home Assistant is installed and what we should improve. As you can see in our installation overview, the operating system installation type is by far the most popular. This makes sense as this is our recommended type of installation and the easiest to use. It offers the full Home Assistant experience and can be managed entirely through the user interface. No text editors, Linux experience, or computer science degree required.
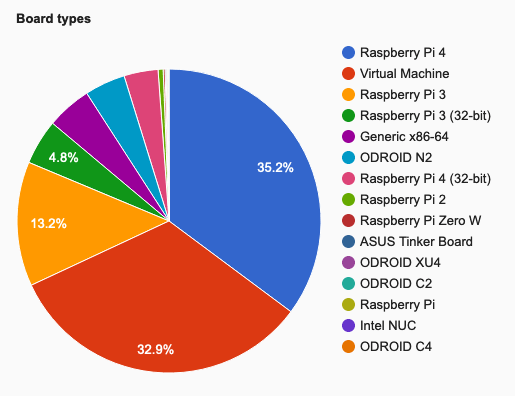
The following board breakdown is for the type of operating system installation only. The Raspberry Pi family of devices is by far the most popular way to run Home Assistant, followed by running in a virtual machine. Running Home Assistant in a virtual machine is popular as this is our recommended approach for users who already have a server at home.
Tracking updates
We’ve spent a lot of time making sure it’s easy to update both Home Assistant Core and the Home Assistant operating system. The ease of updating is important because when critical bugs or security issues arise, users should be sure to click the update button.
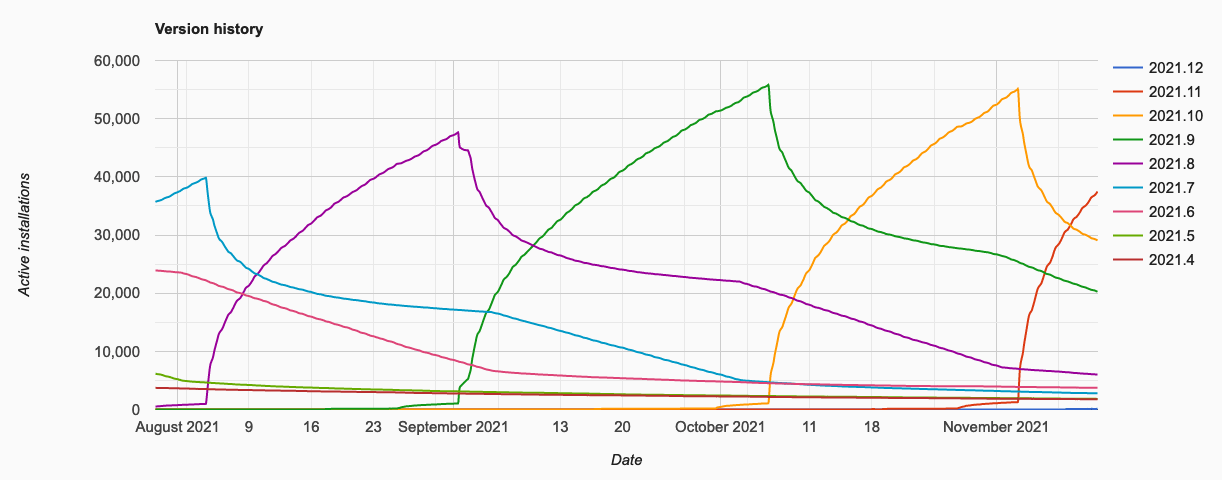
Home Assistant can be updated with a single click in the user interface and is automatically reset if the update fails or the system does not go online afterwards. This gives our users the confidence to update and we see it in the speed our users update when a new monthly version is released:
Home Assistant all over the world
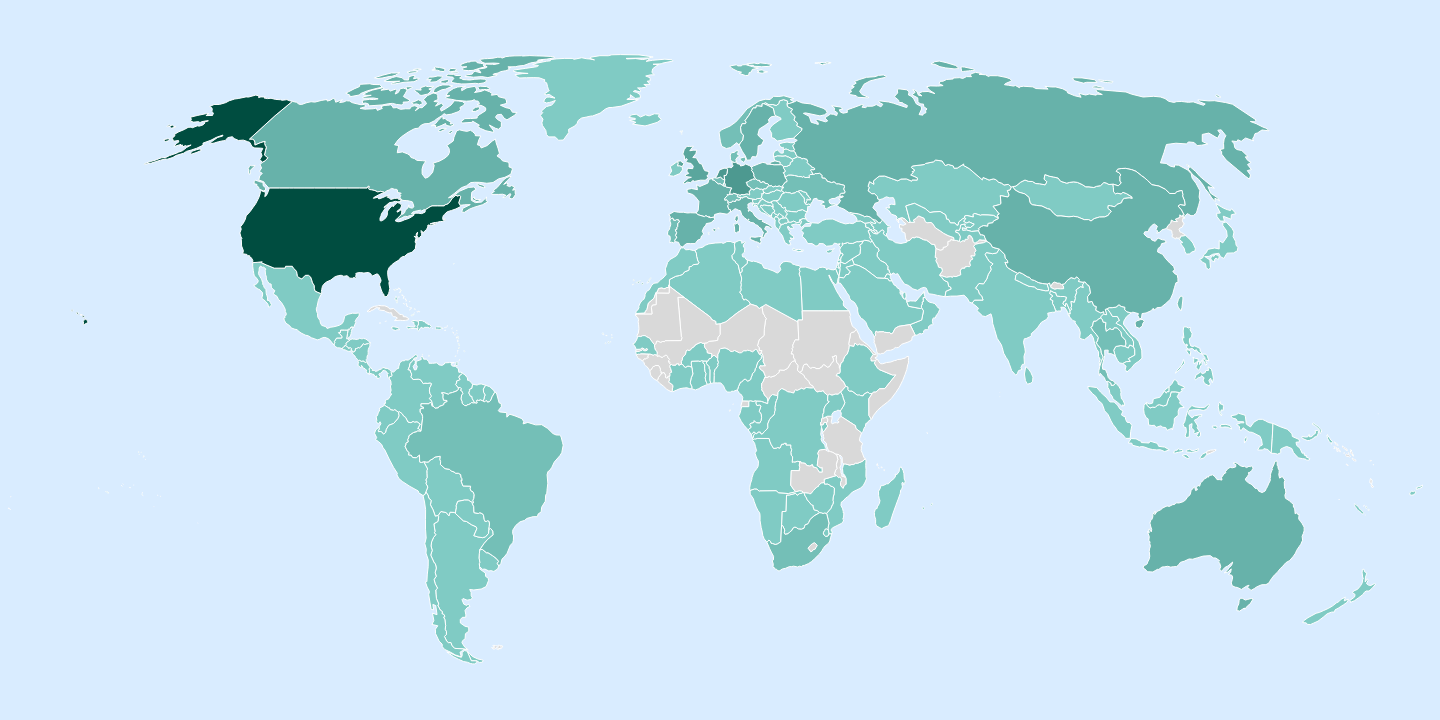
Our goal is to make the privacy-oriented smart home a viable option for everyone and everywhere. Because of this, Home Assistant is free and open source, translated into 60 different languages, and that’s why we incorporate products from all over the world, not just those big enough to come to America or Europe.
As you can see on our map, we have a global reach. Some countries only see a few users, like the country Nepal with 13 installations. With Open Source, however, we only need one employee to translate our user interface into their native language and make it more accessible for speakers of that language. For more information on translating Home Assistant, see the documentation.
Integrations
There are several levels of analysis that users can sign up for. At the base level, you run Home Assistant, but you can also share which integrations you use.
This data is incorporated into the Home Assistant website as users navigate through the various integrations. It sometimes highlights certain integrations that serve their purpose but don’t have a large audience, like the integration for the Dublin bus schedule:

Of course, the most popular integrations are more interesting. I am always amazed at how high MQTT is on this list and I am delighted that ESPHome is doing so well.
For the full list, see Home Assistant Analytics.
We see that integrations that offer automated discovery do very well. This makes sense because after the discovery we will ask the user to set it up:
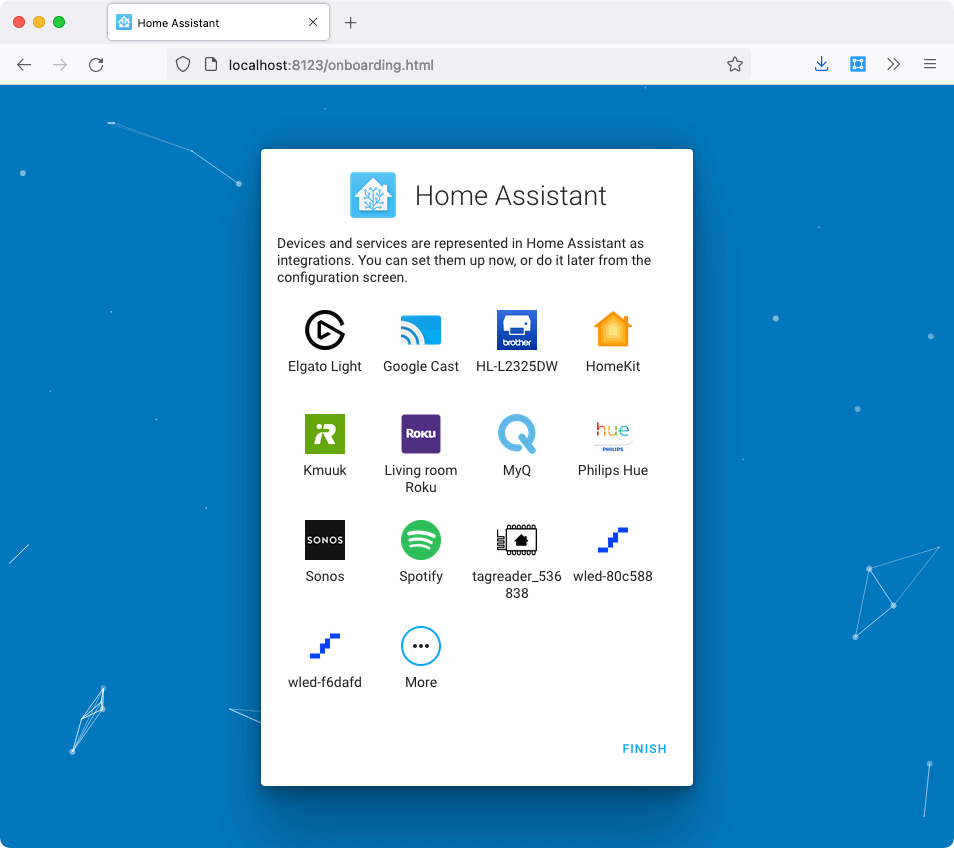
Screenshot of setting up integrations when onboarding Home Assistant
statistics
It is also possible to share some basic statistics about your installation, such as: B. How many states and users you have.
- Average number of automations: 24
- Average number of integrations: 74
- Average number of installed add-ons: 7.01
- Average number of units: 204
- Average number of users: 1.87
It’s impressive how many integrations and entities are used in Home Assistant. Our users love to automate their home!