Bitcoin (BTC) is expected to end well below analysts’ target guidance of $ 100,000 in 2021. Kraken CEO Jesse Powell, who had also forecast a price target of USD 100,000 for Bitcoin, remains optimistic over the long term, but does not rule out an A. short-term sharp decline.
One of the drawbacks that could put bitcoin under pressure in the short term is the shift in monetary policy by the US Federal Reserve. On December 15, the Fed announced that it would run the bond purchase program at a faster pace and also forecast three rate hikes in 2022.
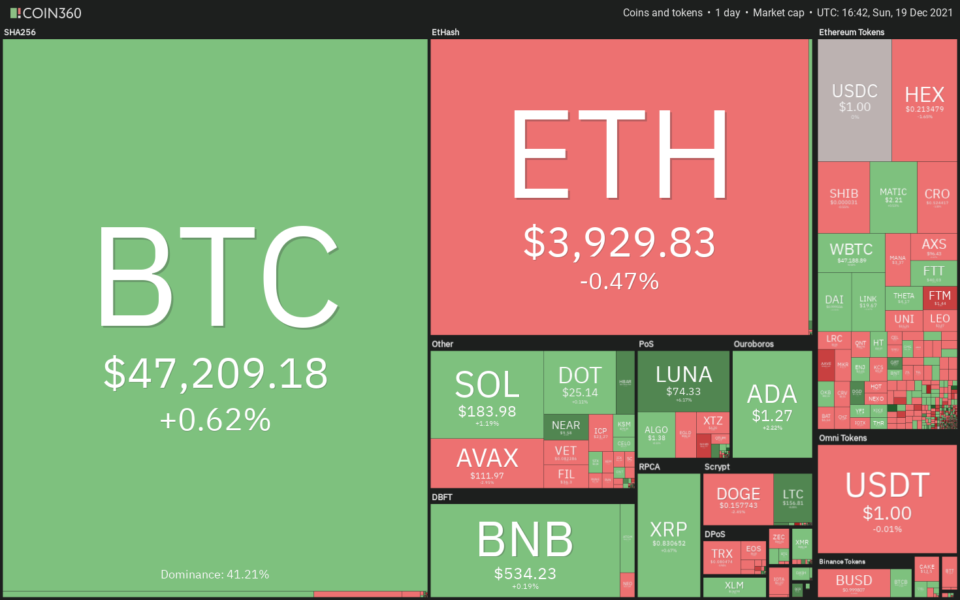
Daily view of crypto market data. Source: Coin360
Sam Stovall, CFRA Research’s chief investment strategist, said CNBC that the S&P 500 has historically tended to generate negative returns over the 12 month period if the Fed hikes three or more interest rates.
If history repeats itself, Bitcoin could also struggle to run away due to its strong correlation with the S&P 500 at various stages in 2021. It is difficult to predict whether investors will continue to buy Bitcoin to hedge their portfolio against rising inflation in the event of risk – off-sentiment leads to profit bookings.
Given this uncertainty, let’s turn to the charts and do a long-term bitcoin analysis to determine the critical levels to look out for.
BTC / USD
Bitcoin’s sharp rally in 2017 saw the relative strength index (RSI) rise above 96, suggesting a state of euphoria among traders. Vertical rallies are seldom sustained and are usually followed by a sharp correction or period of consolidation. It did so after the bull movement ended in 2017.
 BTC / USD monthly chart. Source: TradingView
The BTC / USD pair remained stuck below its December 2017 highs until the breakout above $ 20,000 in December 2020. This shows a long basic education period of around three years.
The pair’s sharp rally in 2021 sent the RSI above 91 in March before profit bookings kicked in. Unlike 2017, however, the bulls aggressively defended the 20-month exponential moving average ($ 37,281).
This suggests that sentiment remained positive and traders took advantage of the dips to accumulate. The subsequent rally drove the pair to a new all-time high of $ 69,000, but the bulls were unable to sustain the higher levels. This shows that traders are making profits on rallies.
The sharp correction has pulled price towards the 20 month exponential moving average (EMA) again and the RSI is showing signs of negative divergence, suggesting that bullish momentum may be wearing off.
If bears sink and hold the price below the 20-month EMA, the pair could fall to the critical support at $ 28,800. This is an important level for the bulls to defend as a break below it could lead to a long period of base building.
On the flip side, if the price rises from current levels, the pair could retest $ 69,000. A break and close above this resistance could signal the resumption of the uptrend.
 BTC / USD weekly chart. Source: TradingView
The bulls pushed the price above the $ 64,899 level twice but failed to hold the higher levels. This could have trapped the aggressive bulls who bought the outbreak, resulting in a lengthy liquidation.
The 20-week EMA ($ 52,016) has started to decline gradually and the RSI has slipped into negative territory, suggesting the bears are trying to make a comeback. The bulls tried to defend the 50-week simple moving average (SMA) ($ 47,709) but failed to push the price above the 20-week EMA.
This could have resulted in further selling and the bears are now trying to lower the price to the next strong support at $ 39,600. This is an important level for the bulls to defend because if it cracks the pair could fall to $ 28,732.
Such a move could delay the start of the next leg of the uptrend and keep the pair within a range of $ 28,732 on the downside and $ 69,000 on the upside.
On the contrary, if price rises from current levels and breaks above the 20-week EMA, the bulls will make another attempt to break the overhead resistance zone of $ 64,899- $ 69,000.
If successful, bullish momentum could pick up and the pair could begin its journey north towards the $ 100,000-109,000 price zone where the rally could face strong headwinds.
Alternatively, a break and close below $ 28,732 could result in a bear market with the next strong support at $ 20,000.
Related: Bitcoin is testing the annual moving average as $ 100,000 needs a “little miracle” by Christmas
 BTC / USD daily chart. Source: TradingView
The pair has been down within a descending channel for the past week. Both moving averages are sloping down and the RSI is in negative territory, suggesting the bears are in control.
If the price drops from current levels or the 20-day EMA (USD 50,054), it suggests that sentiment remains bearish and traders are selling on rallies. This could pull the price to the December 4th intraday low of $ 42,333.
This is an important level for the bulls to defend because when it cracks the bears will try to bring the price below the channel’s support line. If they succeed, sales could intensify further.
The zone between $ 39,600 and $ 37,300 can serve as strong support, but unless the bulls push the price above the 20-day EMA, the decline can extend to $ 28,800.
Conversely, if the price rises and breaks above the resistance line of the channel, it signals that selling pressures may ease. The pair could then move to the 50-day SMA ($ 56,524), which could be challenging again.
The bulls need to push and hold the price above the 50-day SMA to signal the start of an upward move to $ 60,000. This level can act as strong resistance, but if exceeded the rally could retest the all-time high.
The views and opinions expressed are those of the author only and do not necessarily reflect the views of Cointelegraph. Every step of investing and trading involves risk, you should do your own research when making a decision.